Flux Language is the shiny new query language that comes with InfluxDB 2.0. Since it is “the future”, and the OSS (free) version of InfluxDB 2.0 is not getting the old query language support in (at least) the first few versions, I’ve been using Flux Language for some new projects. Meanwhile, the (functional) documentation for both the Flux Language and its support in Grafana does not exist yet. In this post, I’d like to give some examples to quickly address common data processing needs, for both server monitoring and simple BI usages.
Disclaimer: InfluxDB 2.0 is currently in beta, so things might change quickly. All examples are verified against the follow versions of software:
- InfluxDB Version 2.0.0 (37cc047)
- Grafana Server v7.3.4 (14c494085e)
This post focuses on the Flux Language grammar, so I’ll assume you have no issue setting up InfluxDB (HTTP API, dashboard) and Grafana. If you need help on connecting InfluxDB to Grafana, see How to Build Grafana Dashboards with InfluxDB, Flux and InfluxQL.
You also need to know the basic terms for InfluxDB (v1 or v2). If not, read InfluxDB data elements now.
Basics
Graph is the default (and most intuitive) panel type in Grafana, so we’ll start with it. On every refresh, a panel sends all the queries to the selected InfluxDB data source, then draws every series returned as one line. (Key take: One series, one line. ) Note that a query might return more than one series. Here’s an example of one query returning 3 series:
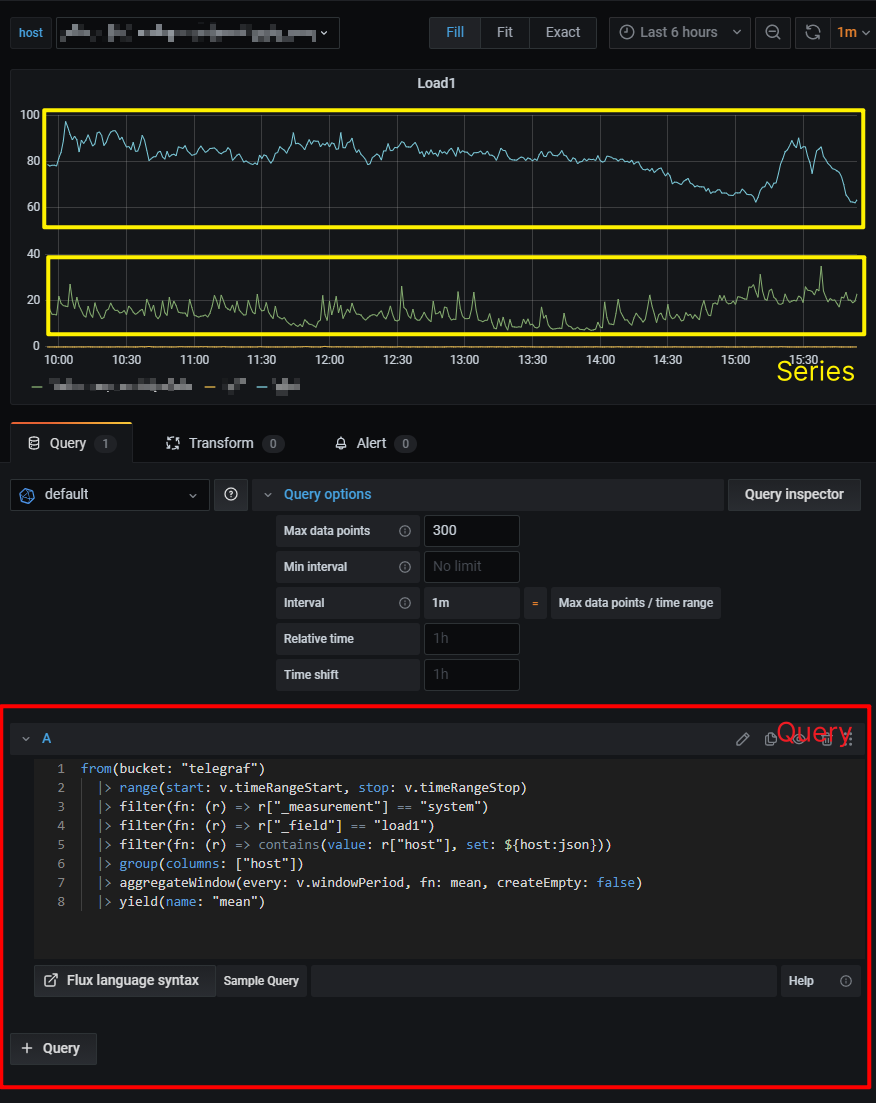
Other panel types works largely the same way.
In InfluxDB documentation, a series is called a table which is confusing. I’ll use the term series throughout the post.
Debugging Flux Query
To effectively debug your Flux query, we’ll use the InfluxDB dashboard (it was called Chronograf, and was a separate installation). We’ll be only using the Data Explorer.
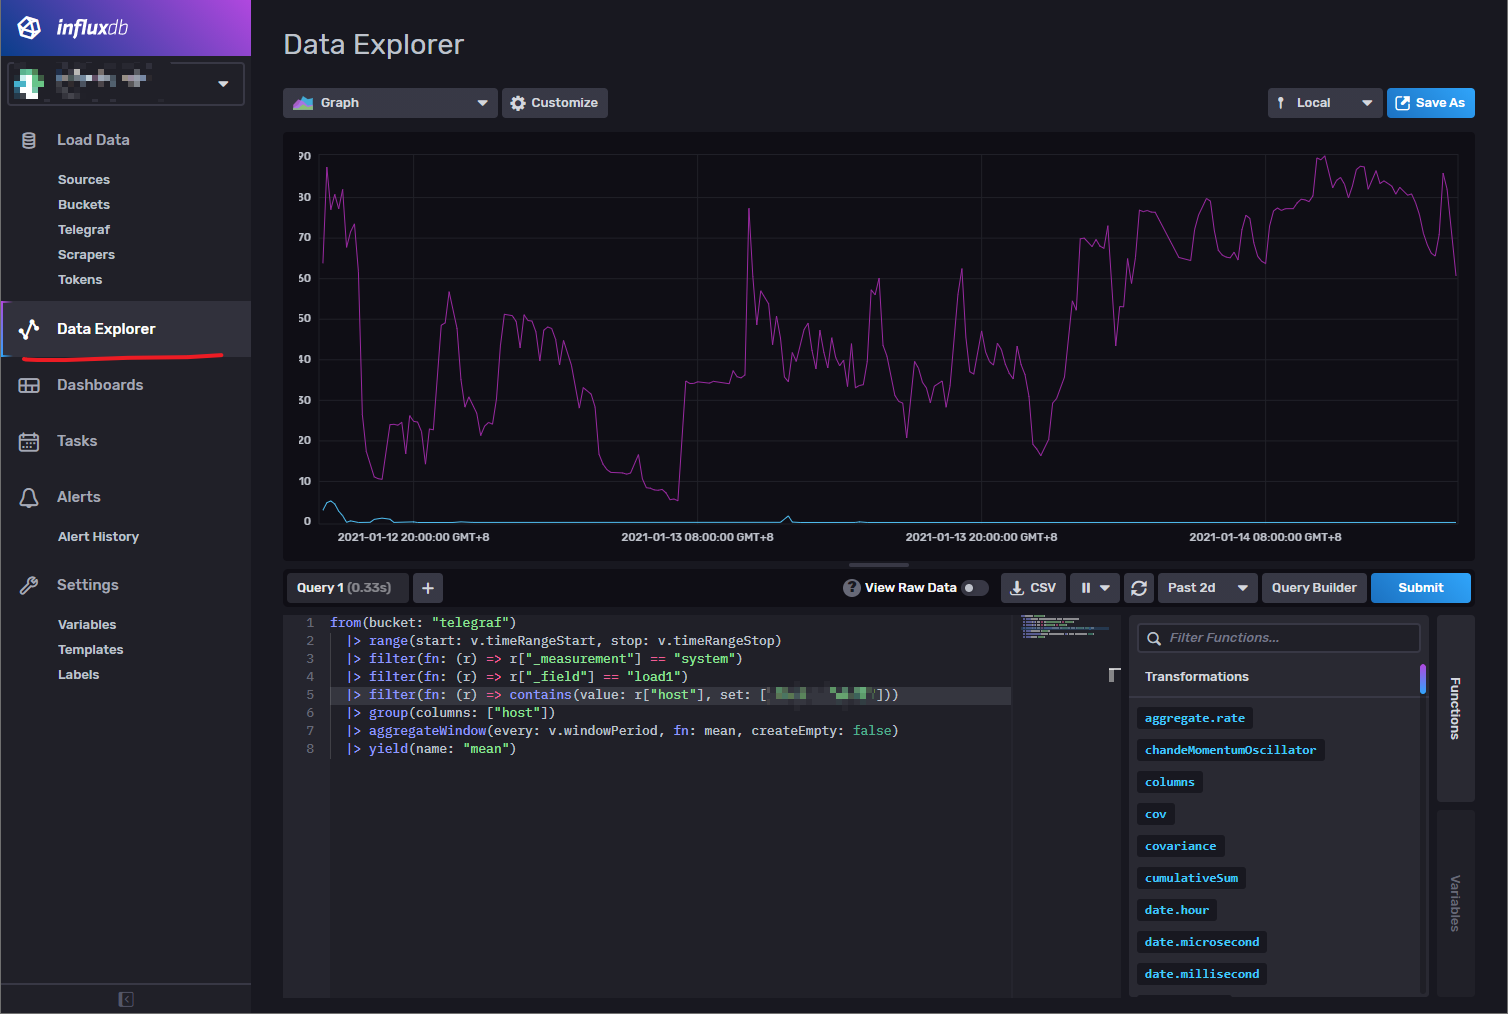
After you get to the Data Explorer, you should:
- Click on the “Script Editor” left of the blue “Submit” button
- Click on the “Graph” dropdown menu on the top left, and select “Table”
The “Table” display mode will tell you what actual data is returned from your query. Depends on what your query is, you should see one of the two interfaces.
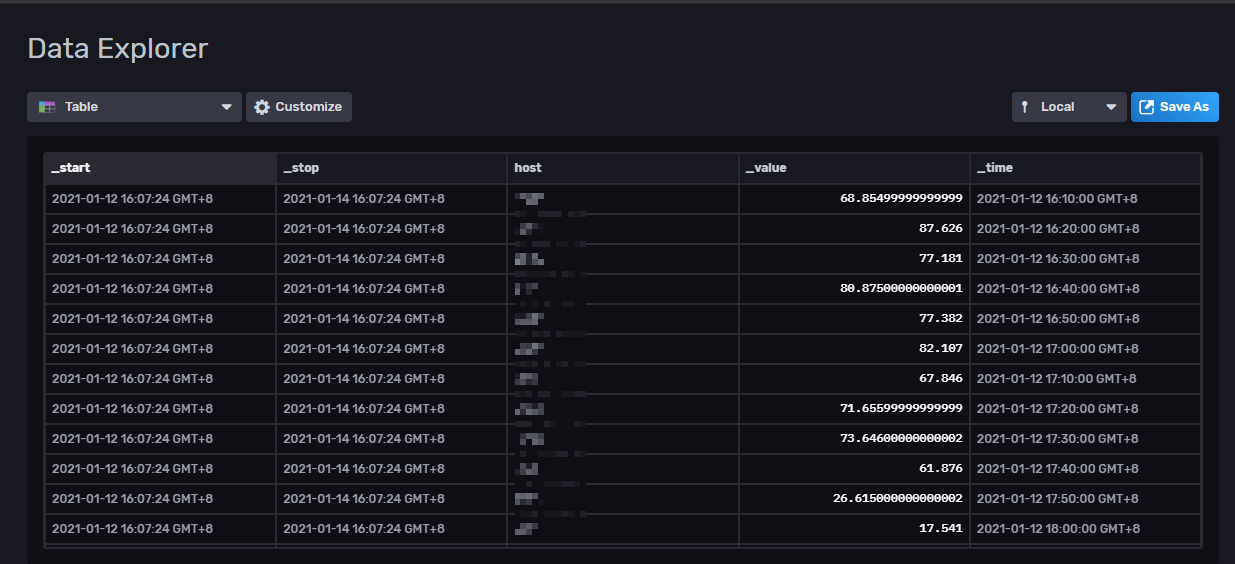
This is what you see when only one series is returned from your query:
This is what you see when multiple series are returned from your query:
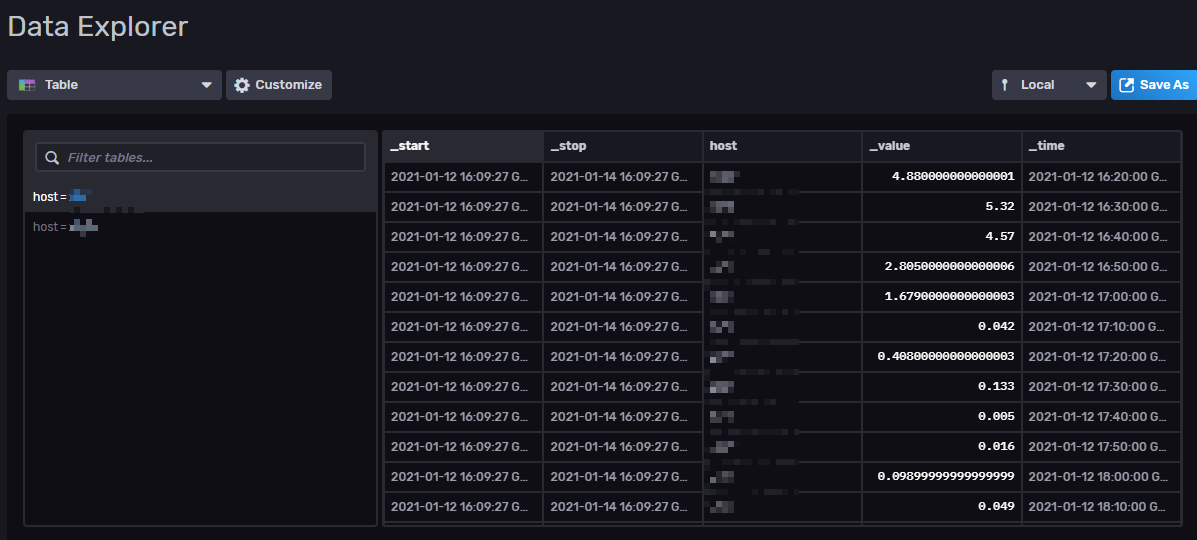
Note that the series key is displayed on the left.
Querying Data
Nearly every Flux query start with the following 3 instructions:
|
1 2 3 |
from(bucket: "your-bucket-name") |> range(start: v.timeRangeStart, stop: v.timeRangeStop) |> filter(fn: (r) => r["_measurement"] == "your-measurement-name" and r["_field"] == "your-field-name") |
Feel free to add more filters so we are only left with exactly what we need. For example, you can use regex ( =~ for matching, !~ for not matching):
|
1 |
|> filter(fn: (r) => r["name"] =~ /^(sd[a-z]+|vd[a-z]+|nvme\d+n\d+|mmcblk\d+)$/) |
Or drop some columns, only leaving useful ones:
|
1 |
|> keep(columns: ["_field", "_time", "_value"]) |
Use
|
1 |
|> yield() |
to return the current data. You can use it more than once in the query, just set the name argument to something different. If you only need to return once, yield() can be omitted.
Changing Series Display Name
Grafana does not support using tag variables in query series names anymore. Instead, there are 2 simple rules:
- If the series key only contains one key=value segments, the value is used as the series’ display name
- If the series key contains more than one key=value segments, its full, JSON-formatted string is appended to the table name as the series’ display name
So if you write your query like this:
|
1 2 3 4 5 |
from(bucket: "telegraf") |> range(start: v.timeRangeStart, stop: v.timeRangeStop) |> filter(fn: (r) => r["_measurement"] == "disk") |> filter(fn: (r) => r["_field"] == "used_percent") |> yield(name: "disk_usage") |
You will get series names like this:
|
1 |
disk_usage {device="dm-0", fstype="xfs", host="localhost", mode="rw", path="/"} |
Which is very annoying. In order to rename a series, we can inject its name into every row with a map() function call:
|
1 2 3 4 5 |
|> map(fn: (r) => ({ _value: r._value, _time: r._time, name: "${r["host"]}/${r["device"]}" // here is our new series name })) |
Don’t be surprised if there is only one series returned, because the map rule removed your original series key. We need to regroup this large plain table back to different series with another function call:
|
1 |
|> group(columns: ["name"]) |
So our final query will look like this:
|
1 2 3 4 5 6 7 8 9 10 11 |
from(bucket: "telegraf") |> range(start: v.timeRangeStart, stop: v.timeRangeStop) |> filter(fn: (r) => r["_measurement"] == "disk") |> filter(fn: (r) => r["_field"] == "used_percent") |> map(fn: (r) => ({ _value: r._value, _time: r._time, name: "${r["host"]}/${r["device"]}" })) |> group(columns: ["name"]) |> yield(name: "disk_usage") |
Already excited? Let’s have more fun.
More String Operations
String interpolation is a more concise method for achieving the same result.
String interpolation
This claim is actually not correct, and I’ll show you why. We’ve already used a little bit string interpolation.
|
1 |
name: "${r["host"]}/${r["device"]}" |
We can use dot notation to access a dict too:
|
1 |
name: "${r.host}/${r.device}" |
But what if r.device might be null? You can’t use string interpolation any more, or you’ll have the following error:
|
1 |
runtime error @10:6-14:8: map: failed to evaluate map function: string expression evaluated to null |
And you can’t use fill() because tags cannot be filled.
Well, you can use string concentration with a type cast:
|
1 |
name: "${r.host}/" + string(v: r.device) |
but if r.device is null, the full string evaluates to null, This might or might not be what you want. If you want some default value for null strings, write your own function using the unary operator exists .
Selecting and Aggregating Data
There are some selectors and aggregate functions which, when called, is applied to every series independently at the same time. So there’s a common pattern to use them:
- Use a group() function call to divide your data into temporary series
- Run the selector or aggregate functions on the temporary series
- Use another group() function call to divide your data back to their logical series for display
For example, you have the following data:
| _time | cashier | item | sales_count |
| 2020-01-01 | Amy | apple | 1 |
| 2020-01-01 | Amy | banana | 3 |
| 2020-01-01 | Li Hua | apple | 4 |
| 2020-01-01 | Amy | orange | 6 |
| 2020-01-02 | Li Hua | apple | 2 |
| 2020-01-02 | Amy | banana | 5 |
| 2020-01-02 | Li Hua | orange | 8 |
and you want to display a graph of how much items is sold per day per person, regardless of the item. There is a function, sum(), which accumulates every value of a column and outputs a new table consisting only one row. So you have to do this:
First group your data by time + anything you want to keep to the end
|
1 |
|> group(columns: ["cashier", "_time"]) |
Then run sum() on the column we want (as a result, the “item” column will be discarded)
|
1 |
|> sum(column: "sales_count") |
Finally re-group the data by person. Grouping may not keep the data order, so you might want to sort it again:
|
1 2 |
|> group(columns: ["cashier"]) |> sort(columns: ["_time"]) |
Use group() to put everything into a single series. You can also use window() to group your dataset by a time window if required.
Change some of the Fields in a Row
You’ve already know that map() can be used to transform every row. But how to only change some of the fields while leaving other fields intact? There is a shorthand on the {} operator:
|
1 |
|> map(fn: (r) => ({r with _value: r._value + 1.0}) |
Grafana Dashboard Variables
To get a list of tags, use the following query:
|
1 2 3 4 5 6 7 8 |
import "influxdata/influxdb/schema" schema.tagValues( bucket: "your-bucket-name", tag: "your-tag-name", predicate: (r) => true, start: -1d ) |
If you want multiple selection of tags, use this filter:
|
1 |
|> filter(fn: (r) => contains(value: r["your-tag-name"], set: ${grafana_variable_name:json})) |